How We Use Codex, Claude Code, to expedite Cloudwatch Alarm investigations
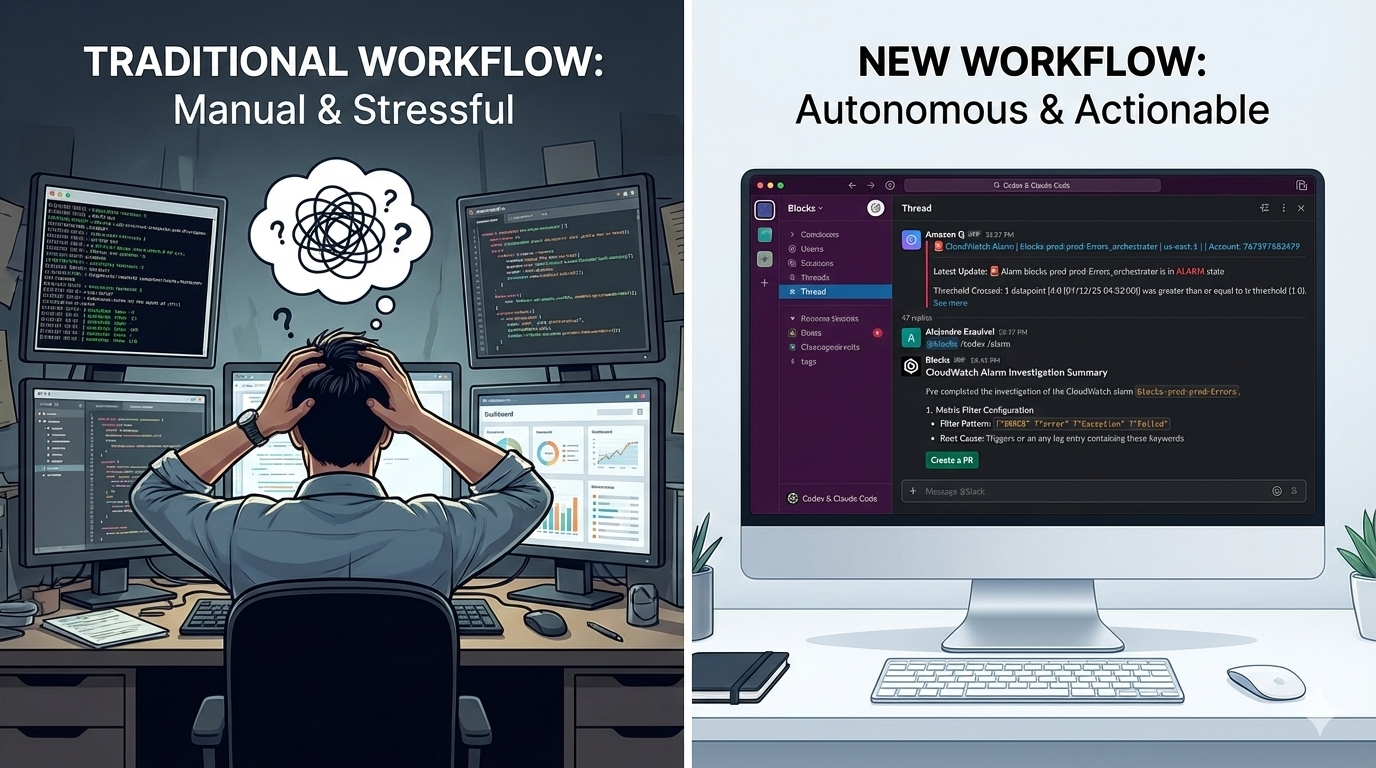
Engineers mute staging and development alarms because investigating them is too cumbersome. The same 30-45-minute workflow (open AWS console, filter log streams, search for patterns, identify codebases, and identify the associated code) repeats for every alert. When critical issues do slip through to production, that investigation delay becomes costly.
We've collapsed the entire investigation into a single Slack interaction. @mention Blocks in any CloudWatch alarm thread, and Codex autonomously analyzes logs, correlates errors across services, with Claude Code implementing recommended fixes. A few minutes later, you have a complete investigation report and can decide whether to create a PR, rollback, or fix forward, all without leaving Slack.
The Traditional CloudWatch Investigation Workflow
When a CloudWatch alarm fires, it lands in your #alerts channel with basic information: which metric triggered, which threshold was crossed, and a timestamp. But this is rarely enough to actually understand what's happening.
The investigation process typically looks like this:
- Open the AWS Console: Navigate to CloudWatch, find the right log group
- Filter through log streams: Often thousands of entries across multiple services
- Search for error patterns: Grep through logs, look for stack traces, identify correlated failures
- Identify affected codebases: Figure out which services and repositories are involved
- Context-switch to IDEs: Open the relevant projects locally
- Start debugging: Finally begin understanding the actual code that's failing
For production incidents, this is time-critical but unavoidable. For staging or development alarms, it's often annoying enough that engineers mute the notifications rather than investigate properly, leading to real issues going unnoticed until they hit production.
The New Workflow: Alarms as Agent Context
We've compressed the entire investigation phase into a single Slack interaction. When a CloudWatch alarm fires in your alerts channel, you can trigger an autonomous investigation directly from the thread.
Here's the complete workflow:
1. Alert Triggers in Slack
Your CloudWatch alarm posts to your #alerts channel with the standard alarm details.
2. @mention Blocks with Investigation Command
Right in the alarm thread, you type:
@blocks /codex Look through the associated CloudWatch logs and find the
offending code causing these errors. Give me the root cause analysis.
Or use our custom canned prompt (Using Blocks commands):
@blocks /codex /alarm
3. Claude Code Gets to Work
Behind the scenes, Blocks automatically:
- Extracts alarm metadata from the Slack thread context
- Queries the associated CloudWatch log groups
- Searches across your microservices for correlated errors
- Analyzes stack traces and error patterns
- Identifies the specific files and functions causing issues
- Has full access to your GitHub repositories to understand the code context
All of this happens in an isolated cloud sandbox. No local setup, no AWS console tabs, no manual log searching.
4. Get a Threaded Investigation Report
Five minutes later, you get a response in the same thread with:
- The specific file and line number causing the issue
- Plain language explanation of what's failing
- When the issue started (correlated with deployments)
- Impact assessment and affected services
- Recommended fix approach
5. Decide Your Next Action
Now you have options based on the situation:
For critical production issues, reply in the thread:
@blocks create a PR for this
Claude Code will generate a fix, run tests, and open a pull request while you coordinate the incident response.
For development/staging alarms, you now have complete context to:
- Make an informed decision about urgency
- Understand if this is a new regression or known issue
- Determine if you need to rollback or can fix forward
- Have specific code locations to investigate if the suggested fix isn't quite right
For resource warnings, you might ask:
@blocks analyze the memory usage pattern and suggest optimizations
Why This Works: Context is Everything
The alarm thread contains sufficient context for an to start an investigation.
When you @mention Blocks from a CloudWatch alert thread in Slack, it automatically has access to:
- Alarm metadata: Which metric, threshold, timestamp, severity
- CloudWatch logs: Via IAM credentials configured in Blocks
- All your codebases: Through GitHub integration
- Related services: Cross-repository context awareness
- Team communication: The Slack thread itself becomes the investigation log
No manual copy-pasting of log group names. No switching between AWS console tabs. No explaining context to the agent. It's already there.
This is fundamentally different from traditional automation because the automation is invoked from the place where the context already exists, rather than requiring you to gather context and feed it into a separate tool.
Augmentation, Not Just Automation
The most valuable aspect isn't always the automated code generation. It's the accelerated human understanding.
Even when the suggested code fix isn't used verbatim, having an agent:
- Pinpoint the exact file and line number
- Explain the error pattern in plain language
- Correlate the issue with recent deployments
- Identify which services are (and aren't) affected
This means on-call engineers make better decisions faster.
You go from "something is broken" to "here's exactly what's broken and here's one way to fix it" in minutes. Whether you use the suggested code, write your own fix, or decide to roll back instead, you're operating from a position of understanding rather than frantically searching through logs.
This augmentation model is especially valuable for:
- Junior engineers on-call: They get expert-level investigation guidance
- Complex distributed systems: Agent can correlate errors across services humans might miss
- Non-urgent alarms: Engineers actually investigate instead of muting notifications
- Incident documentation: The threaded investigation becomes automatic runbook material
Security: Scoped IAM Roles
We take AWS access seriously. Blocks doesn't require broad AWS permissions. You configure scoped IAM roles specifically for CloudWatch log access.
In the Blocks settings, you provide:
- AWS Access Key ID (for a dedicated IAM user)
- AWS Secret Access Key
- Region configuration
We recommend creating an IAM user with a policy limited to the Read IAM permissions it needs, in our case read access to log events and log streams.
This gives Blocks read-only access to specific log groups without broader AWS permissions. The agent can investigate logs but can't modify infrastructure, access databases, or change configurations.
Getting Started
If you're already using Blocks:
- Configure AWS credentials in Settings → Environment Variables (To set AWS environment variables for your scoped down IAM user)
- Set up your CloudWatch alarms to post to a Slack channel
- When an alarm fires, @mention
@blocks /codex /alarmin the thread - Get investigation results and decide your next action
If you're not using Blocks yet, you can sign up at blocks.team and connect your Slack, GitHub, and AWS in minutes.
The Bigger Picture
This CloudWatch workflow is just one example of the core Blocks philosophy: any textbox in your existing tools should be a potential trigger for autonomous engineering work.
You don't need to:
- Set up a separate incident response tool
- Configure complex automation workflows
- Maintain custom scripts for log analysis
- Train your team on new interfaces
The alarm fires in Slack. You @mention an agent in the thread. The context is automatically there. The investigation happens in the background. You get actionable results.
This same pattern works for Linear tickets (@blocks investigate this bug), GitHub PRs (@blocks explain the impact of this change), and any other place your team already communicates about engineering work.
When CloudWatch alarms stop being anxiety-inducing context switches and start being opportunities for instant, AI-powered investigation, your team's relationship with monitoring fundamentally changes. You actually investigate development alarms instead of ignoring them. You debug faster. You make better decisions.
And when 3 AM production alerts do hit, you go from panic to pull request in under 10 minutes, without leaving Slack.
Want to see this in action? Try Blocks free and bring Codex, and Claude Code directly into your CloudWatch investigation workflow.